The influence of the match outcome on physical and technical-tactical performance parameters, considering the own team and the opponent team’s performances in professional football, was preliminarily discussed in the first article. In this second part, the statical procedures adopted and the R code will be presented and discussed.
In the real context of team sports, sports scientists usually deal with small sample sizes (ie., data of their own team) which may compromise the representativeness, reliability, generalizability and power of the findings. Thus, sports scientists should consider employing appropriate statistical techniques, such as non-parametric tests, to mitigate some of the limitations associated with small sample sizes. In this practical case, the purpose was to analyze independent groups (ie., final result of different matches) and its influence in different technical-tactical and physical parameters. To deal with multiple independent groups, Kruskal-Wallis test serves as a non-parametric alternative to parametric one-way ANOVA. Additionally, non-parametric Dunn’s test may be performed for post-hoc pairwise comparisons procedures based on rank sums, following rejection of null hypothesis. For the effect size measurement, Epsilon Squared is an appropriate method.
To perform Kruskal-Wallis test, Dunn’s test and Epsilon Squared and organize the results in an easy to read and understand form (eg. plot), R programming language may be a solution. Thus, ‘ggstatsplot’ and ‘rstatix’ libraries may be used for this purpose, as resumed in the code below.
if (!require(package)) install.packages("readxlt", dependencies = TRUE)
library(readxl)
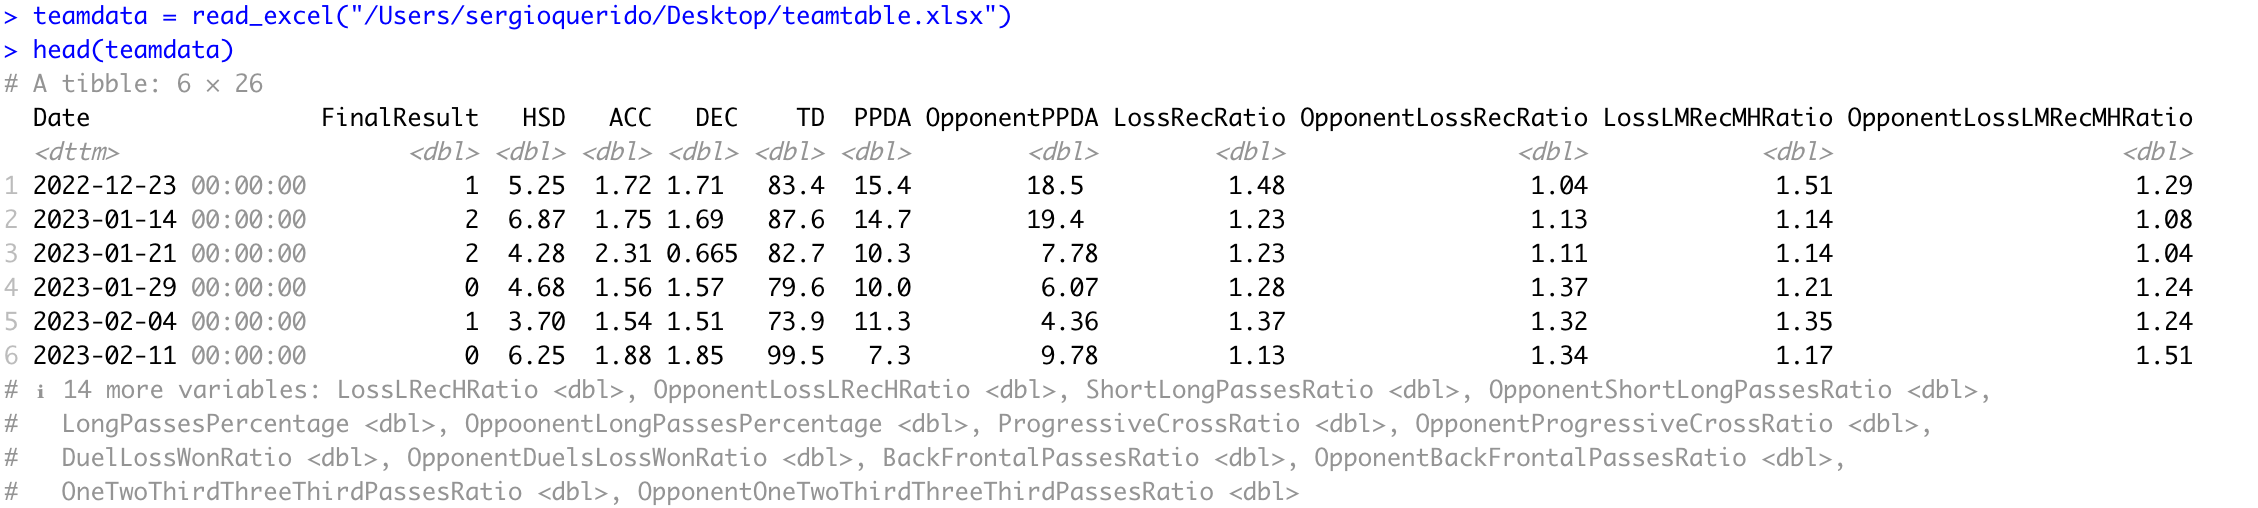
teamdata = read_excel("/Users/sergioquerido/Desktop/teamtable.xlsx")
head(teamdata)
if (!require(package)) install.packages("ggstatsplot", dependencies = TRUE)
if (!require(package)) install.packages("ggplot2", dependencies = TRUE)
library(ggstatsplot)
library(ggplot2)
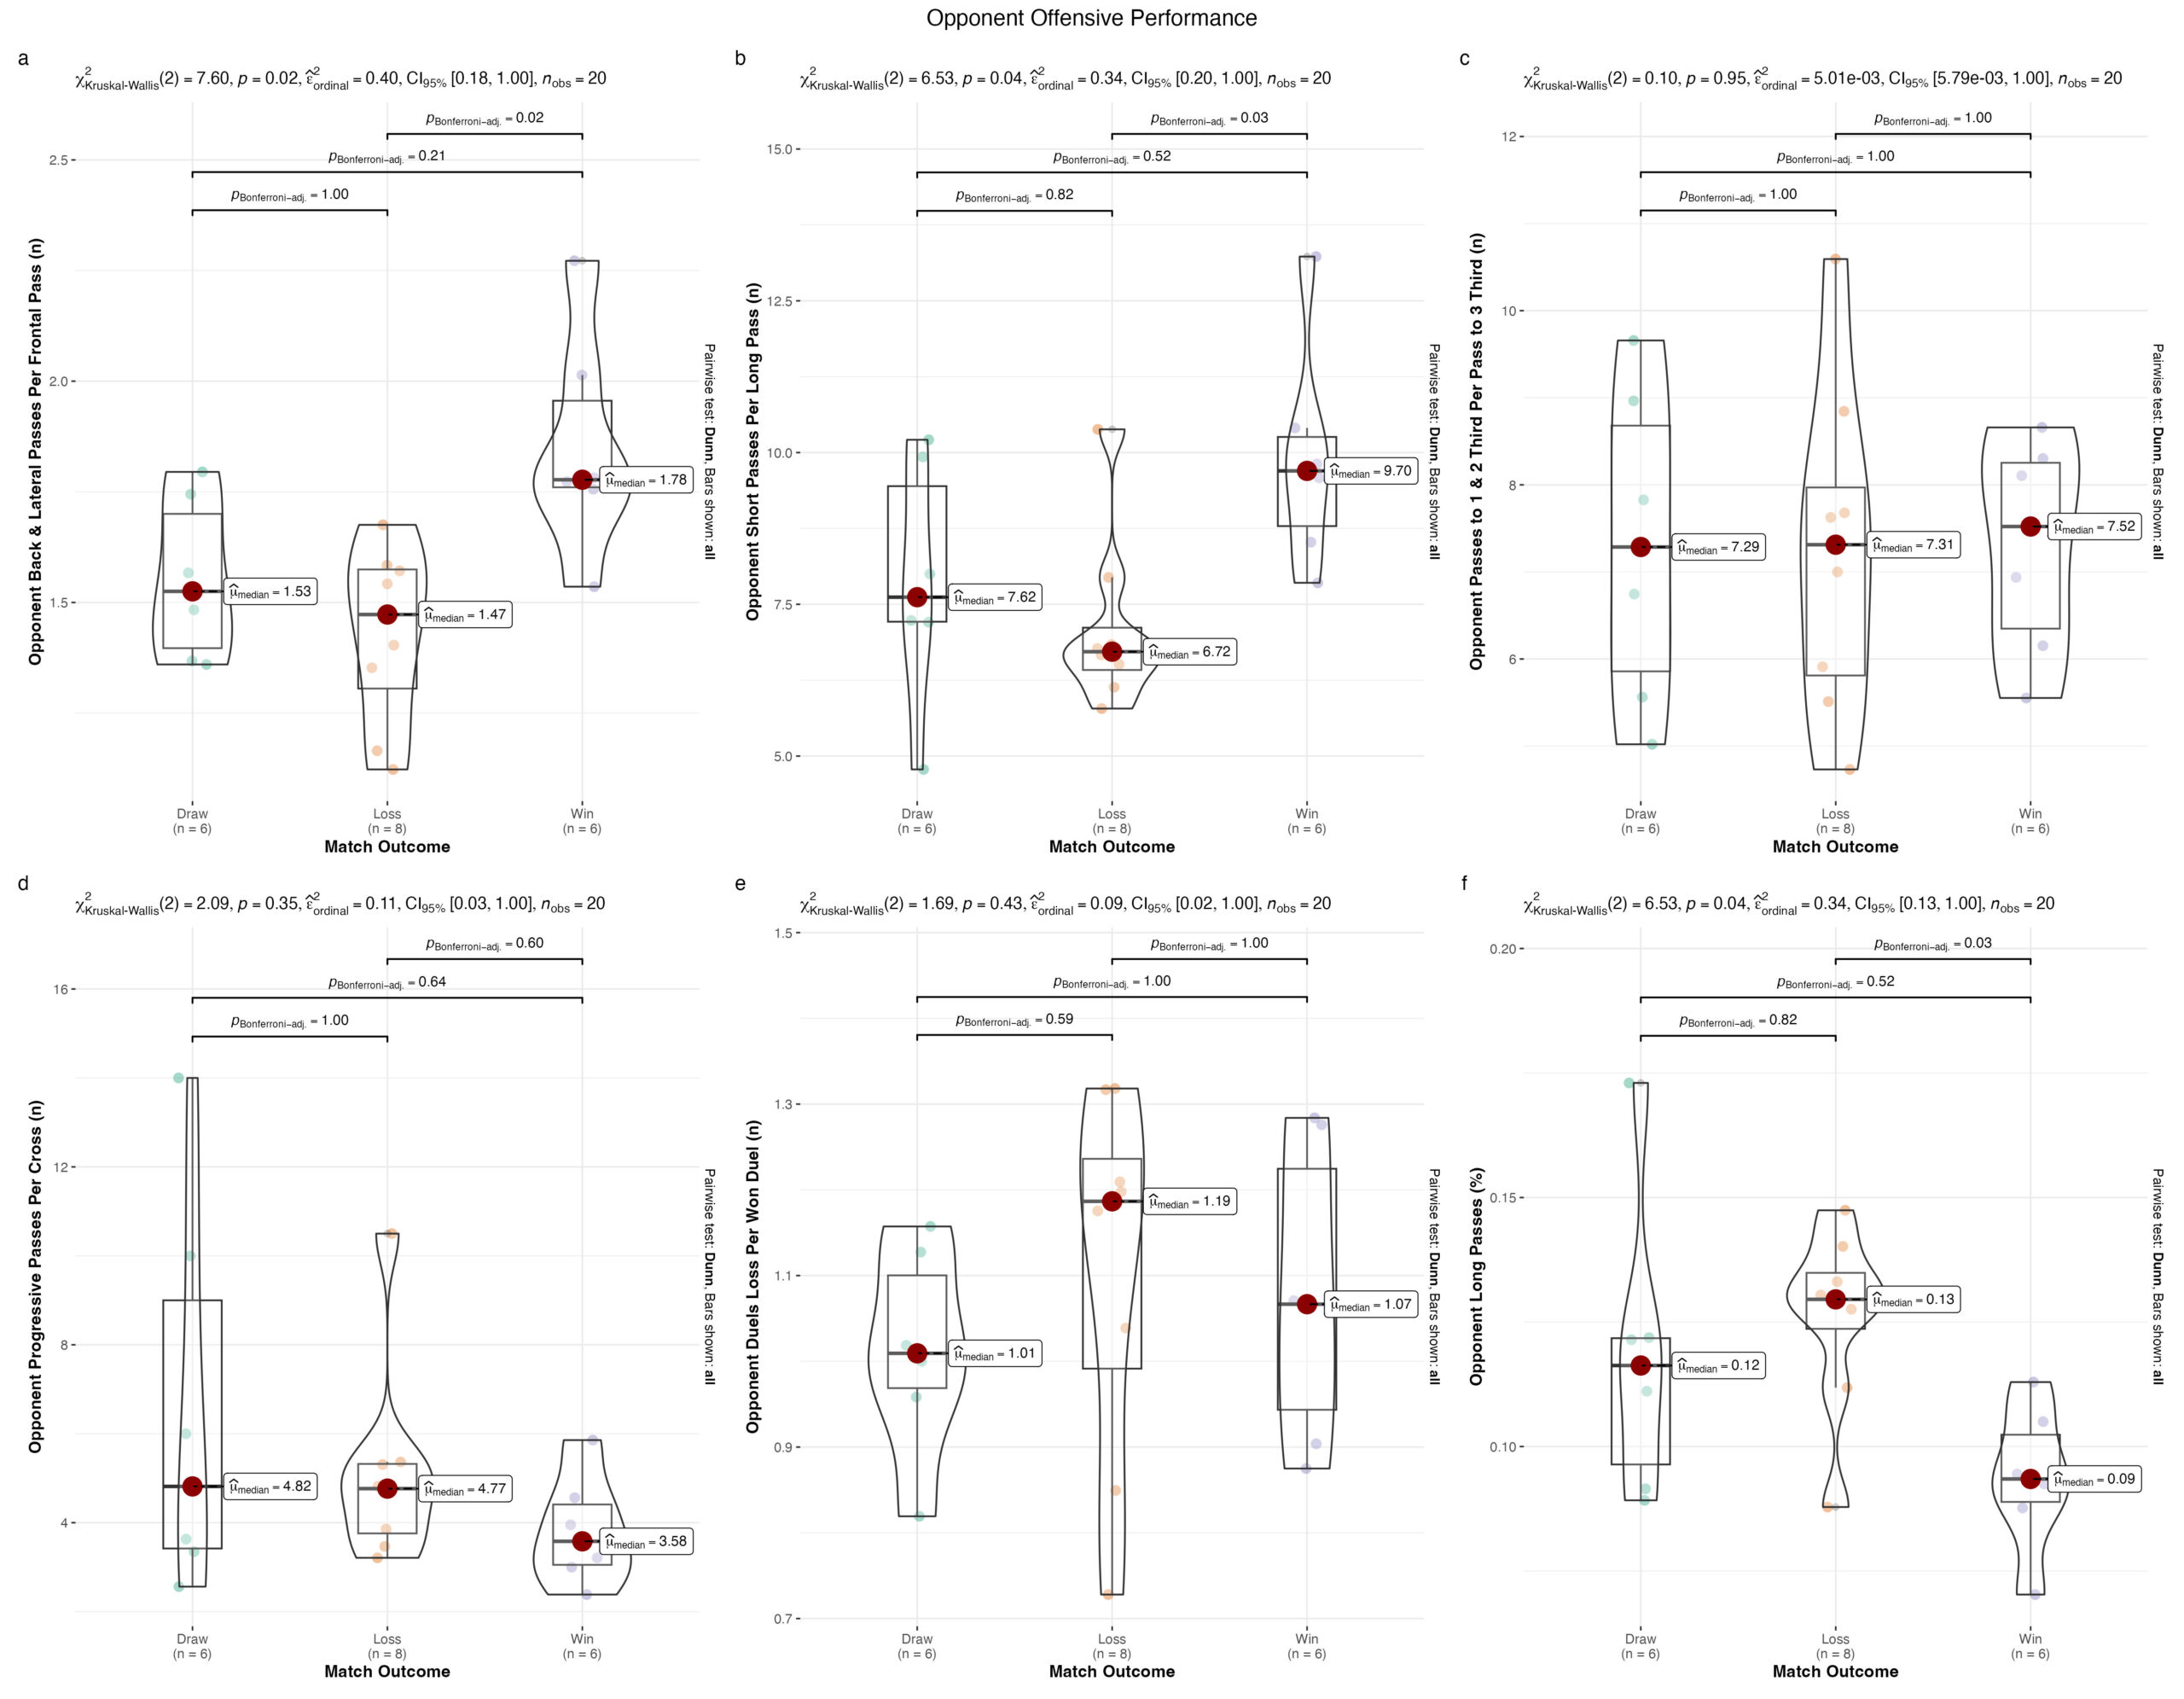
#OPPONENT TEAM OFFENSIVE TECHNICAL-TACTICAL PARAMETERS
p1 = ggbetweenstats(data = teamdata, x = FinalOutcome, y = BackFrontalPassesRatio, type = "nonparametric", p.adjust.method = "bonferroni", pairwise.display = "all")+
labs(x = "Match Outcome", y = "Back & Lateral Passes Per Frontal Pass (n)")
p2 = ggbetweenstats(data = teamdata, x = FinalOutcome, y = ShortLongPassesRatio, type = "nonparametric", p.adjust.method = "bonferroni", pairwise.display = "all")+
labs(x = "Match Outcome", y = "Short Passes Per Long Pass (n)")
p3 = ggbetweenstats(data = teamdata, x = FinalOutcome, y = OneTwoThirdThreeThirdPassesRatio, type = "nonparametric", p.adjust.method = "bonferroni", pairwise.display = "all")+
labs(x = "Match Outcome", y = "Passes to 1 & 2 Third Per Pass to 3 Third (n)")
p4 = ggbetweenstats(data = teamdata, x = FinalOutcome, y = ProgressiveCrossRatio, type = "nonparametric", p.adjust.method = "bonferroni", pairwise.display = "all")+
labs(x = "Match Outcome", y = "Progressive Passes Per Cross (n)")
p5 = ggbetweenstats(data = teamdata, x = FinalOutcome, y = DuelsLossWonRatio, type = "nonparametric", p.adjust.method = "bonferroni", pairwise.display = "all")+
labs(x = "Match Outcome", y = "Duels Loss Per Duel Won (n)")
p6 = ggbetweenstats(data = teamdata, x = FinalOutcome, y = LongPassesPercentage, type = "nonparametric", p.adjust.method = "bonferroni", pairwise.display = "all")+
labs(x = "Match Outcome", y = "Long Passes (%)")
combine_plots(
list(p1, p2, p3, p4, p5, p6),
plotgrid.args = list(nrow = 3),
annotation.args = list(
tag_levels = "a",
title = "Offensive Performance",
theme = theme(plot.title = element_text(hjust = 0.5))))
ggsave(filename = "OffensivePerformance.jpg", plot = last_plot(), dpi = 300, width = 18, height = 14)
if (!require(package)) install.packages('rstatix')
library(rstatix)
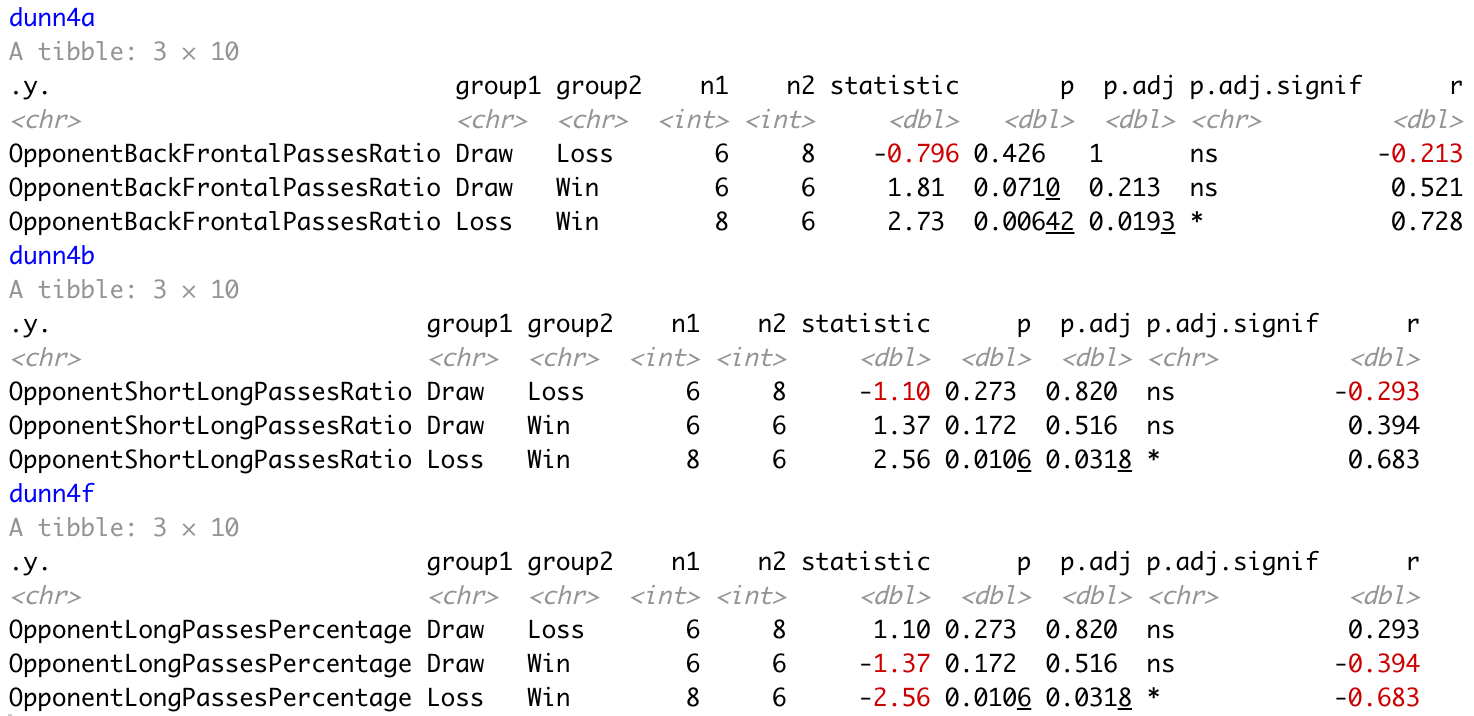
#DUNN'S TEST
dunn4a = dunn_test(OpponentBackFrontalPassesRatio ~ FinalOutcome, data = teamdata, p.adjust.method="bonferroni")
dunn4b = dunn_test(OpponentShortLongPassesRatio ~ FinalOutcome, data = teamdata, p.adjust.method="bonferroni")
dunn4f = dunn_test(OpponentLongPassesPercentage ~ FinalOutcome, data = teamdata, p.adjust.method="bonferroni")
#EPSILON SQUARED
dunn4a$r = dunn4a$statistic / sqrt(dunn4a$n1 + dunn4a$n2)
dunn4b$r = dunn4b$statistic / sqrt(dunn4b$n1 + dunn4b$n2)
dunn4f$r = dunn4f$statistic / sqrt(dunn4f$n1 + dunn4f$n2)
dunn4a
dunn4b
dunn4f
The entire R code used in this article may be download here.