Few studies have investigated how physical and technical-tactical performance parameters differ from lost, draw or won matches in professional football context. Additionally, no studies considered the opponent’s performance to better interpret the own team’s performance after football matches.
Thus, the purpose of this first part of two articles was to discuss the influence of the match outcome on physical and technical-tactical performance parameters, considering the own team and the opponent team’s performances in professional football. In the second part, the statical procedures adopted and the R Code are also presented and discussed.
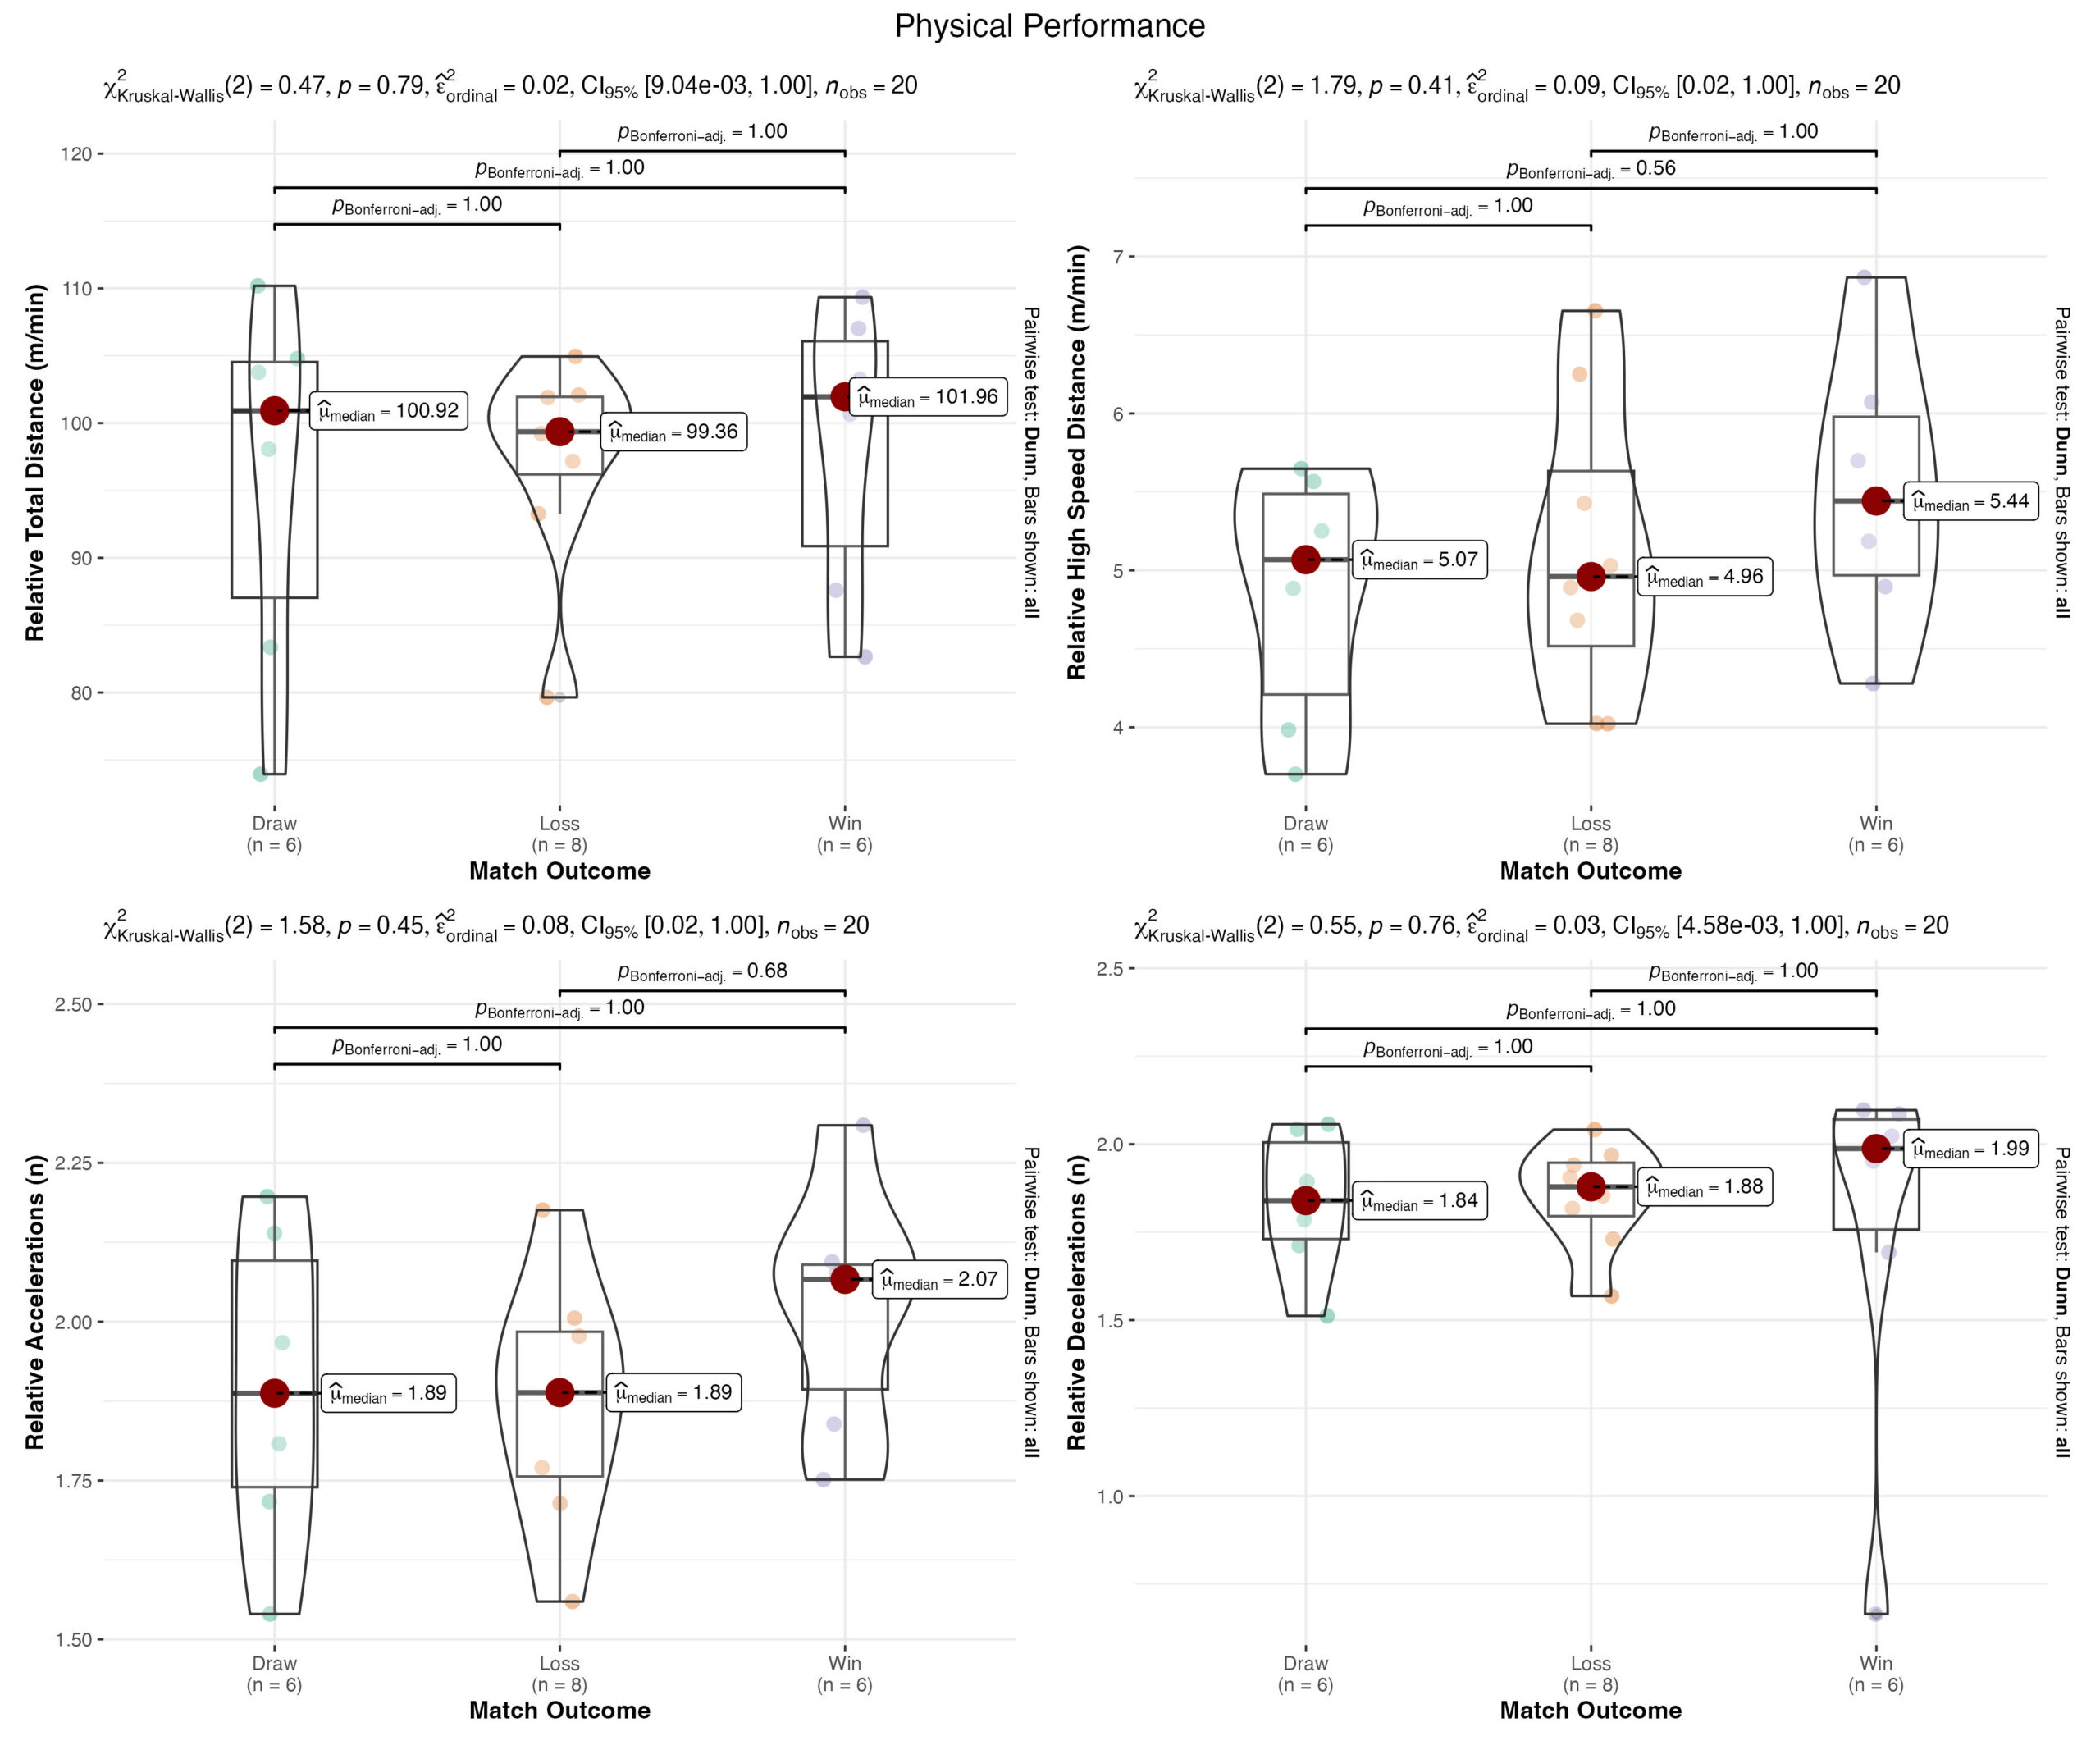
As observed in figure 1, won matches showed slightly higher physical demands (ie., total distance, high speed distance, accelerations and decelerations) than lost matches, although with no significant differences (p>0.05).
In figure 2, the own team’s offensive technical-tactical performance parameters demonstrate some differences between the final match outcomes, although with no significance (p>0.05): 1) graph a shows slightly lower Back and Lateral Passes Per Frontal Pass in won matches than in lost matches; 2) graph b shows slightly higher Short Passes Per Long Pass in won matches than in lost matches; 3) graph c shows slightly higher Passes to One and Two Third Per Pass to Three Third in won matches than in lost matches; 4) graph d shows slightly higher Progressive Passes Per Cross in won matches than in lost matches; 5) graph e shows a slightly higher Duels Loss to Duel Won in won matches than in lost matches; and 6) graph d shows similar Long Passes Percentage in won matches and lost matches.

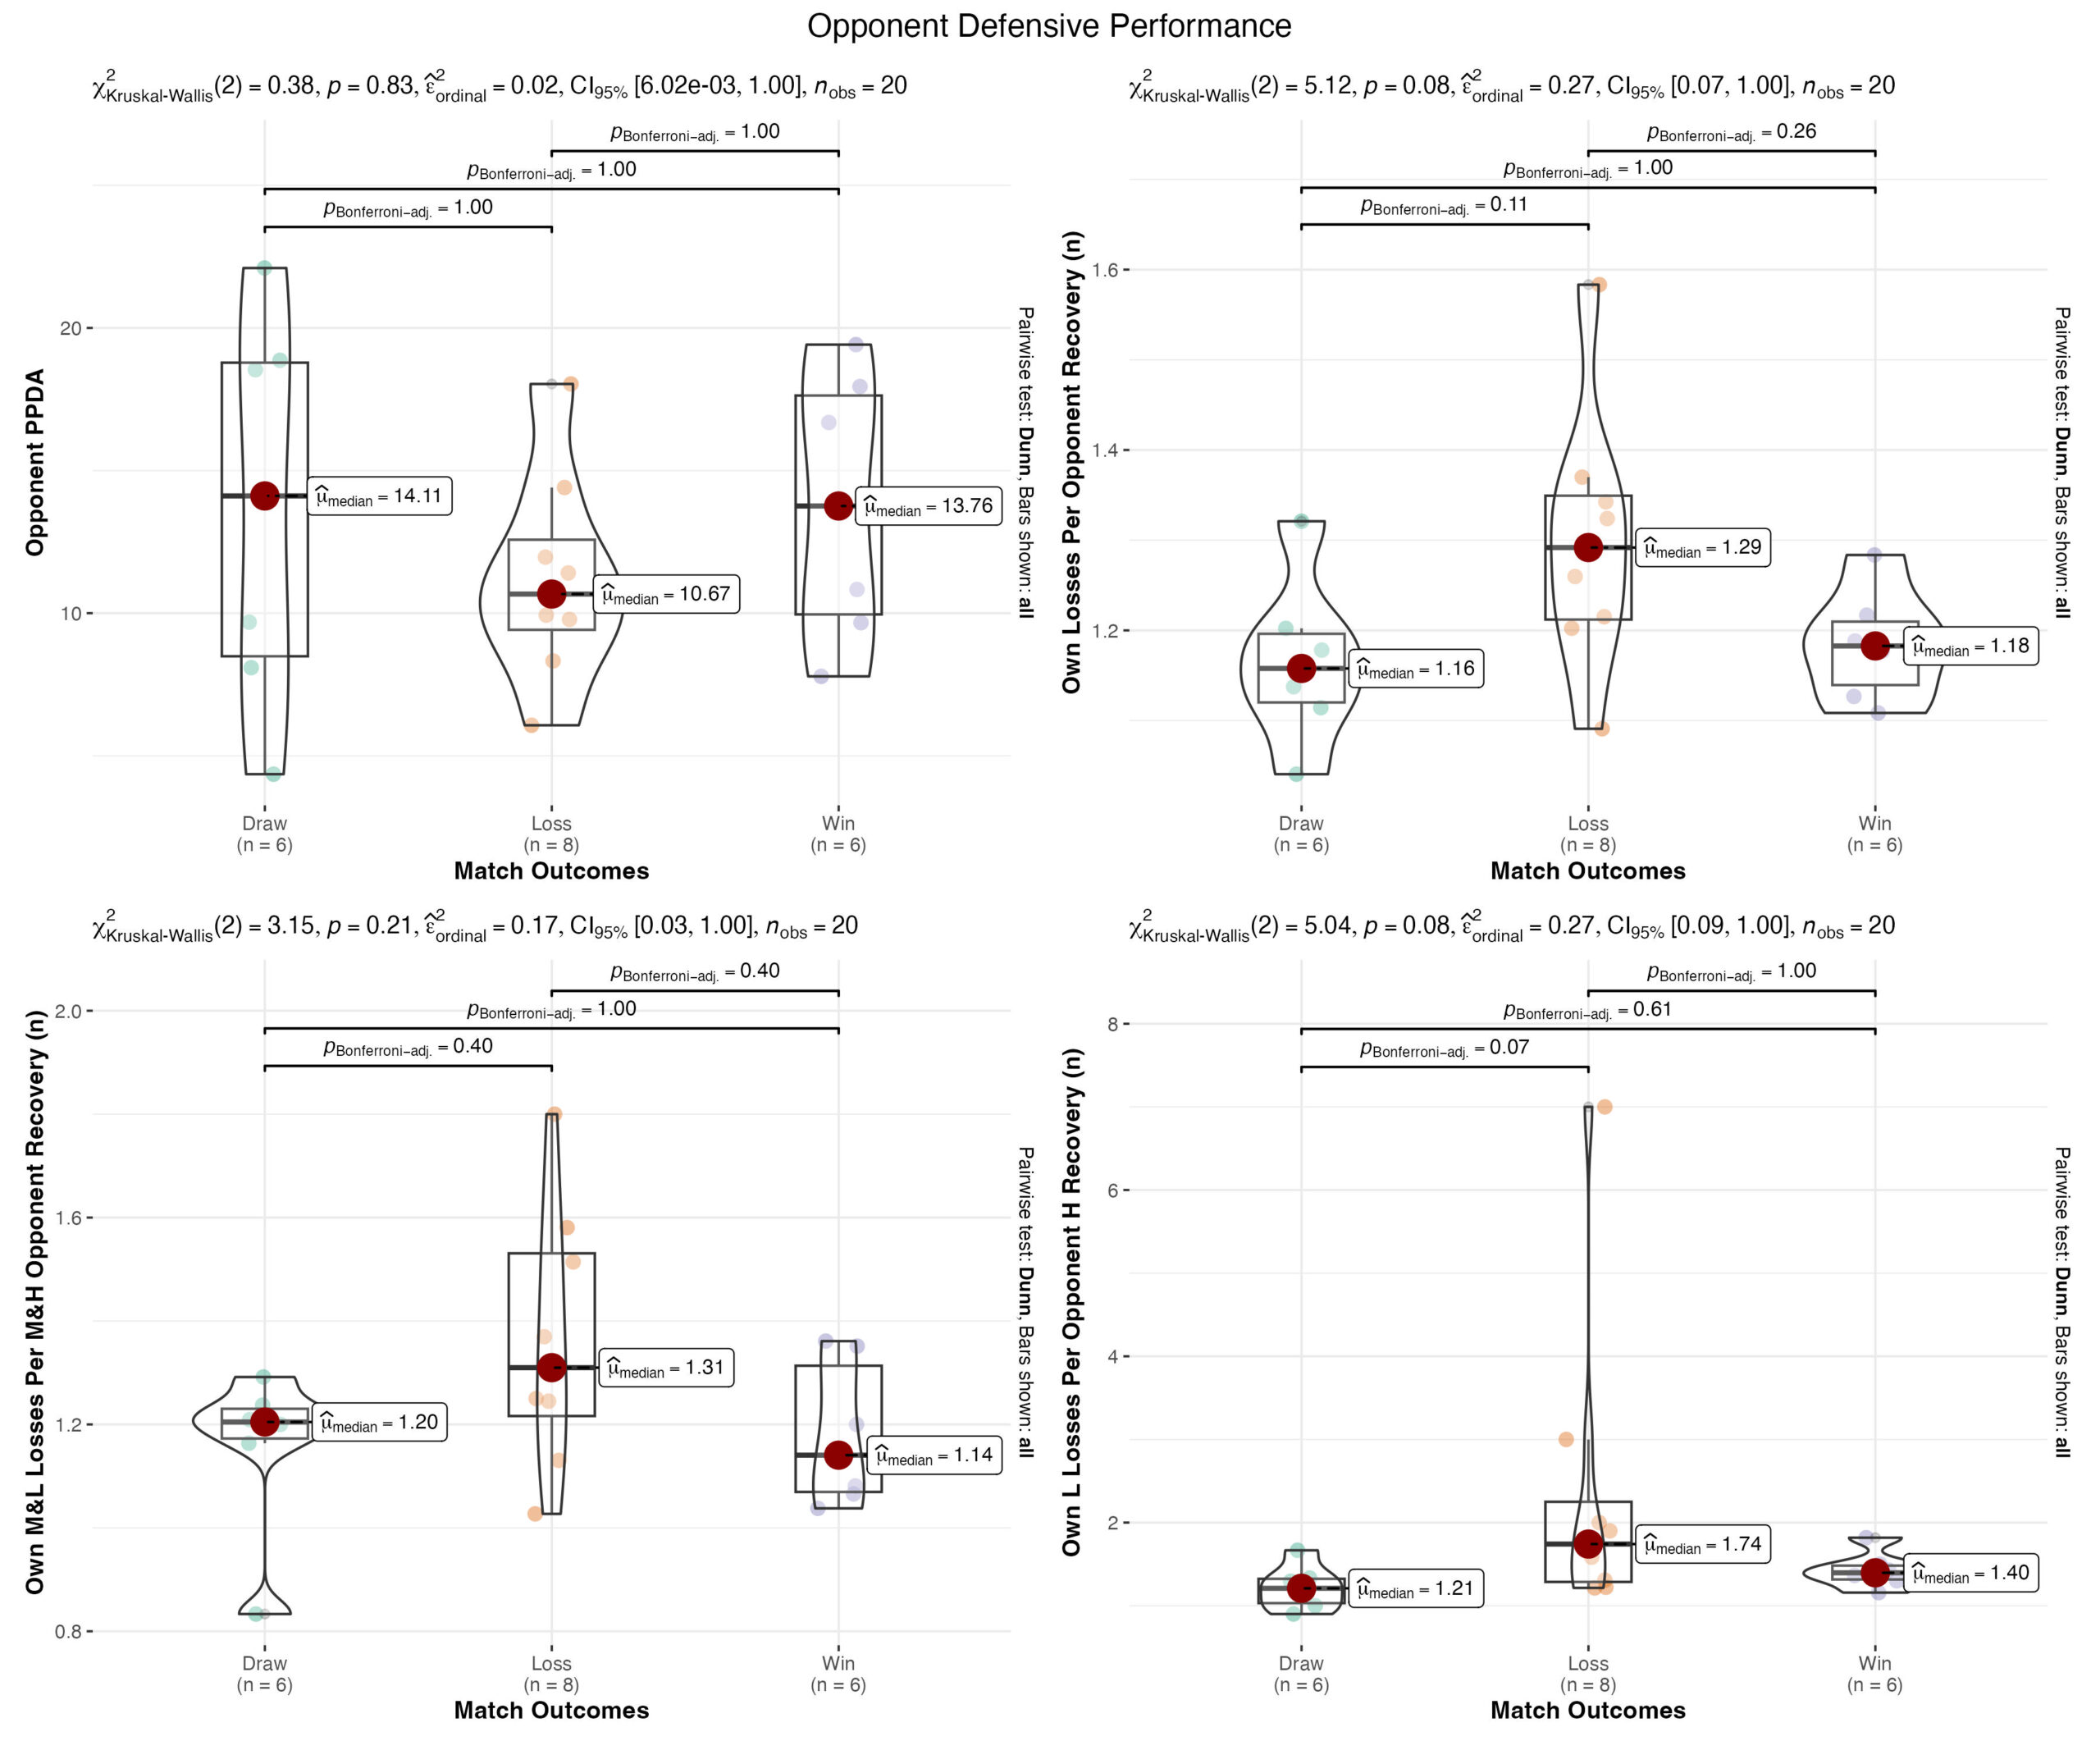
In figure 3, the opponent team’ s defensive technical-tactical performance parameters demonstrate some differences between the final match outcomes, although with no significance (p>0.05): 1) graph a shows slightly higher Opponent Passes Per Defensive Action (PPDA) in won matches than in lost matches; 2) graph b shows slightly lower Own Losses Per Opponent Recovery in won matches than in loss matches; 3) graph c shows slightly lower Own Medium and Low Losses Per Opponent Medium and High Recovery in won matches
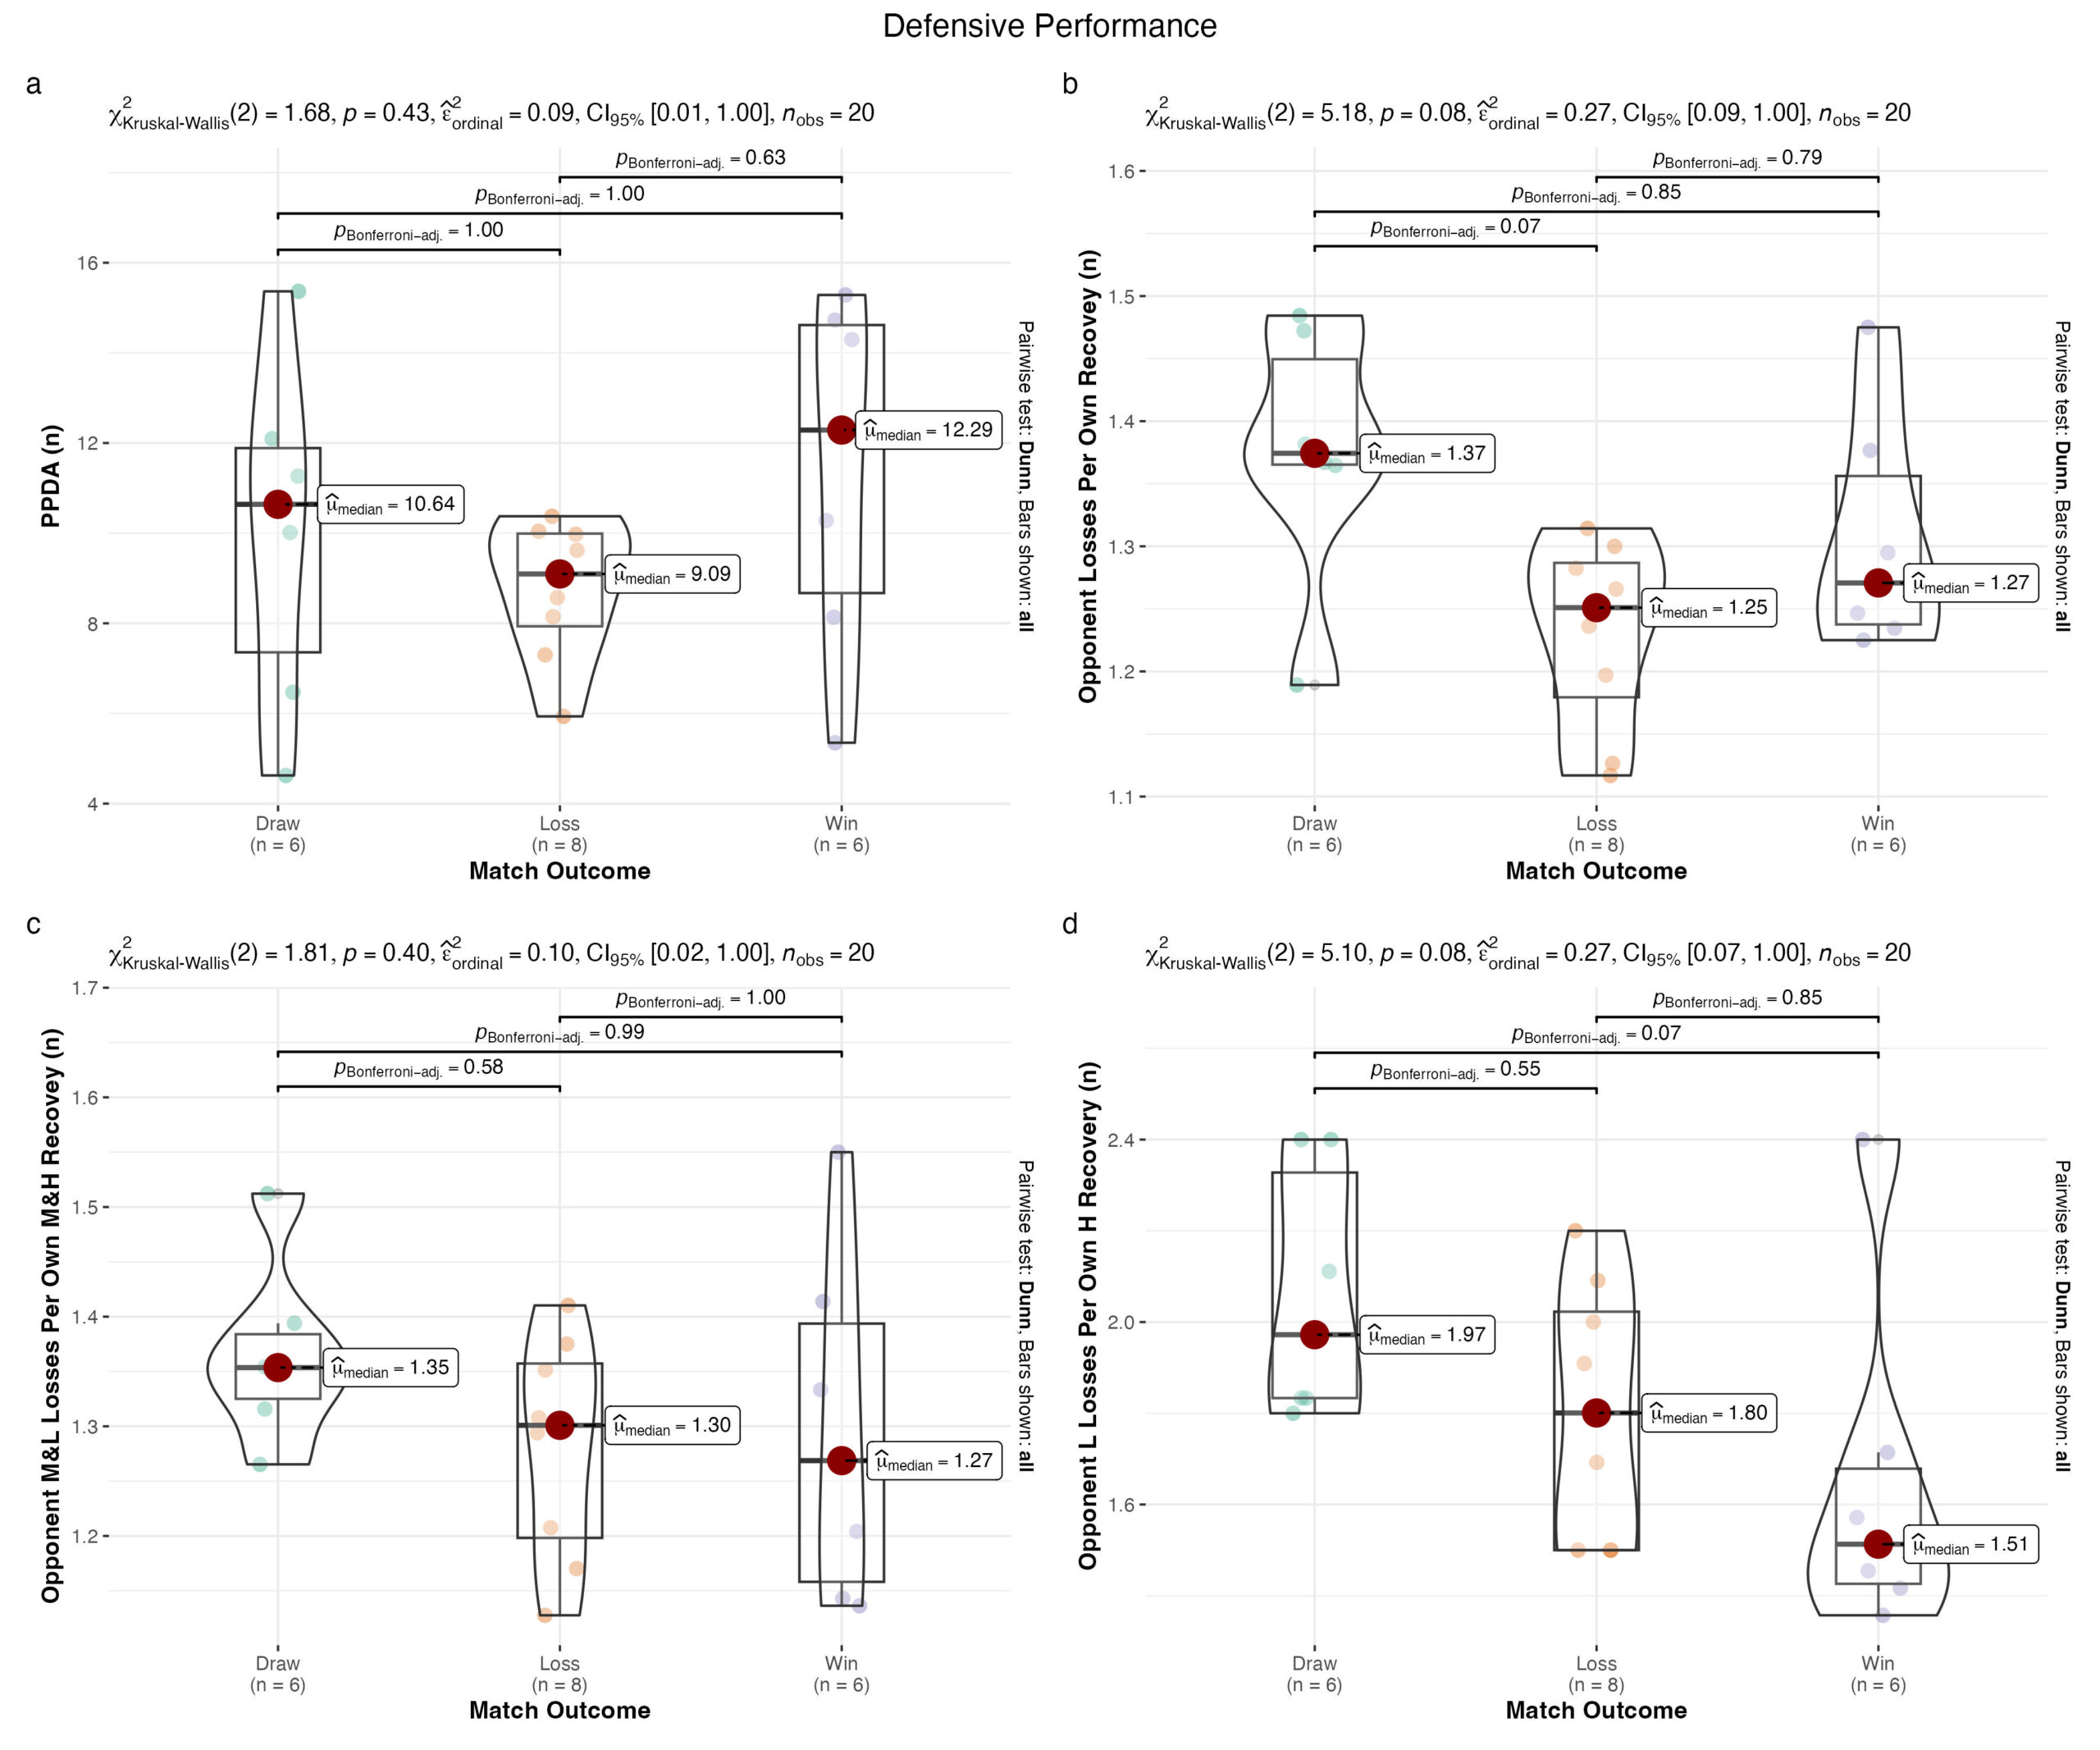
In Figure 4, the own team’ s defensive technical-tactical performance parameters demonstrate some differences between the final match outcomes, although with no significance (p>0.05): 1) graph a shows higher Opponent Passes Per Defensive Action (PPDA) in won matches than in lost matches; 2) graph b shows slightly higher Opponent Losses Per Own Recovery in won matches than in loss matches; 3) graph c shows slightly lower Opponent Medium and Low Losses Per Own Medium and High Recovery in won matches than in lost matches; and 4) graph d shows lower Opponent Low Losses Per Own High Recovery in won matches than in loss matches.
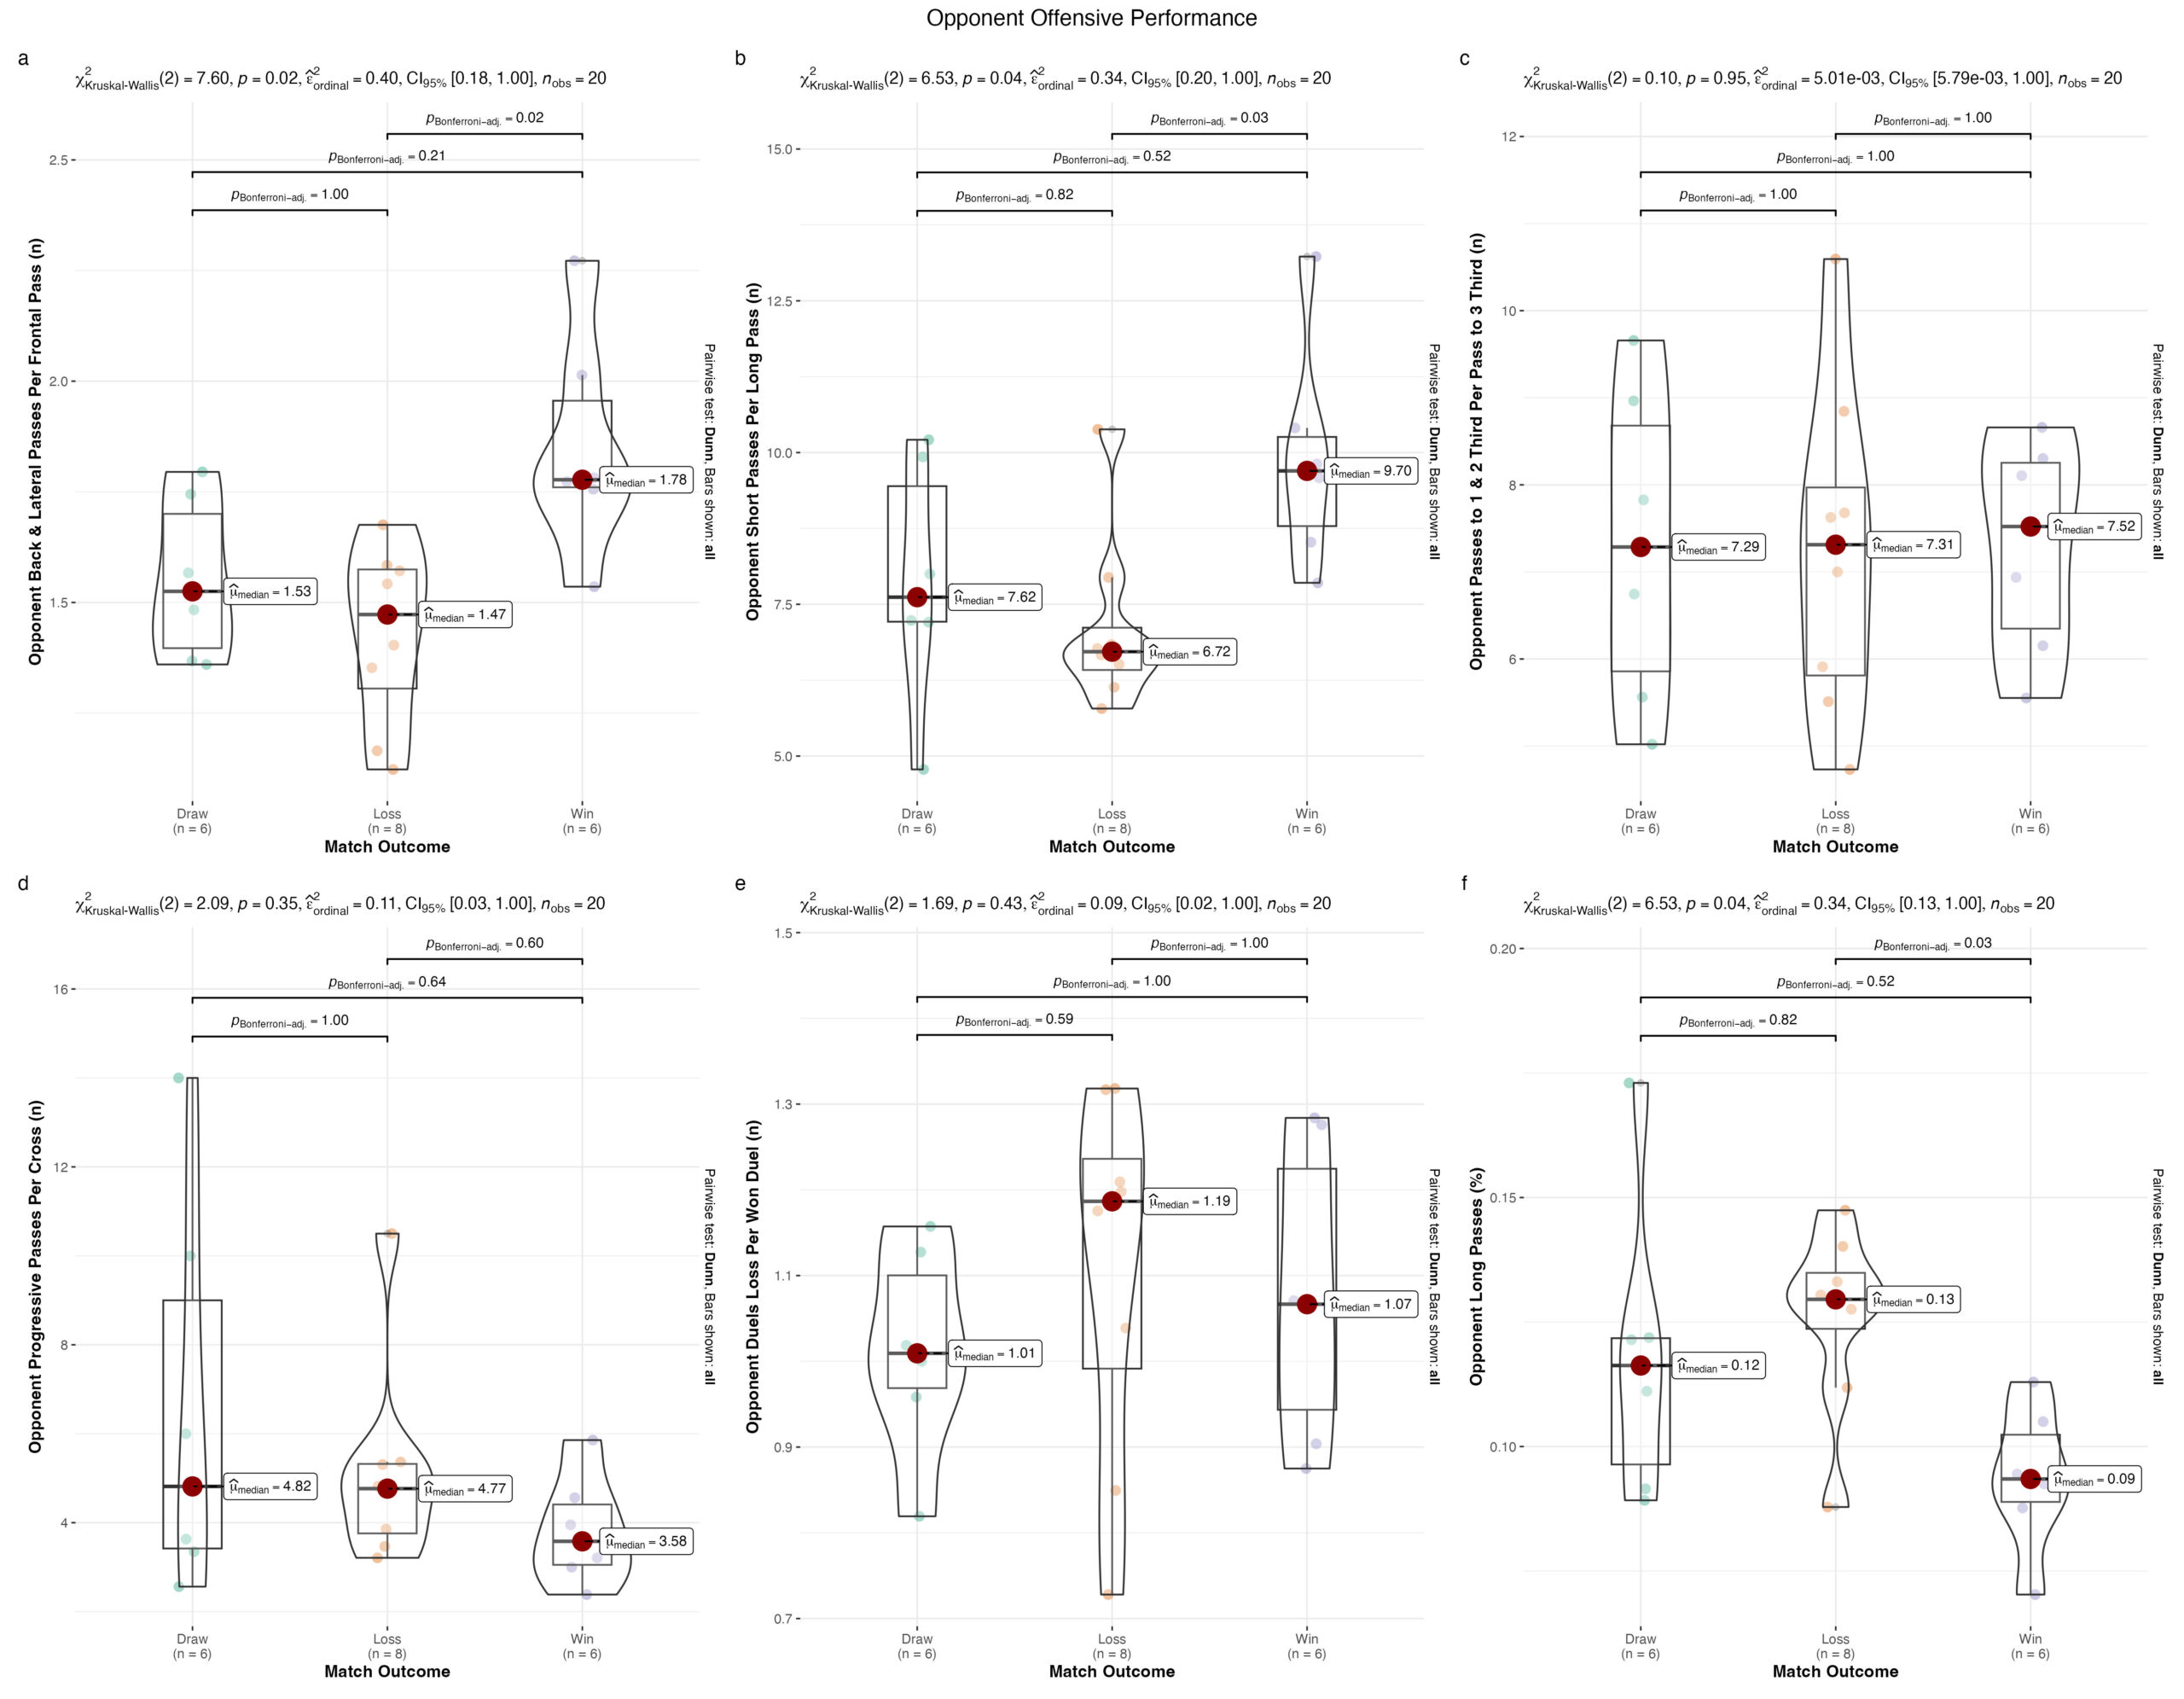
In figure 5, the Opponent team’s offensive technical-tactical performance parameters demonstrate some significant differences between the final match outcomes (p<0.05): 1) graph a shows significant higher (p=0.02; r=0.73) Opponent Back and Lateral Passes Per Frontal Pass in won matches than in lost matches ; 2) graph b shows significant higher (p=0.03; r=0.68) Opponent Short Passes Per Long Pass in won matches than in lost matches; 3) graph c shows slightly higher Opponent Passes to One and Two Third Per Pass to Three Third in won matches than in lost matches; 4) graph d shows slightly lower Opponent Progressive Passes Per Cross in won matches than in lost matches; 5) graph e shows a slightly lower Opponent Duels Loss to Duel Won in won matches than in lost matches; and 6) graph d shows significant lower (p=0.03; 0.68) Opponent Long Passes Percentage in won matches than in lost matches.
According to the results above, in this context of professional football, the passes performed by the opponent team and its characteristics seem to be important variables that may influence the match outcome. Therefore, further analyses should be carried out on professional football to better understand these patterns.